
DeepCap Pro
Insight
Equity research that states its score and shows its working.
Insight notes are written from DeepCap's outperformance model across US, European and Asian markets. Each note states the model's score, the factors behind it and the risks, with the data it rests on, in a form that can be checked line by line.
More companies than any desk can follow
A fundamental research desk follows the companies it can visit, model and debate. That is a few hundred names, and the choice of which few hundred was made years ago. Everything else is judged on a screen, a broker note or a headline.
Systematic coverage closes that gap, and most of it arrives as rankings and factor scores that an analyst cannot interrogate. A number without its reasons is hard to act on and harder to defend in a meeting.
Insight is built so that a company's score can be read, questioned and checked. The note shows what the model measured, how the company ranks against its universe, where the drivers come from, and what the reported numbers say.
What an Insight note contains
Seven of its sections, in the order they are read. The excerpt below is from the note on Apple Inc. for the run of 2 October 2026 and is not current research.
- Company profile. The business, the sector and exchange, key financial data, profitability and growth, and the recent annual history of revenue, EBIT, EPS, free cash flow and margins.
- Performance and risk profile. One-year performance against the regional benchmark, relative performance over the model's six- and twelve-month horizons, and beta, volatility, Sharpe and information ratios.
- DeepCap investment summary. The DeepScore for each horizon, six and twelve months, with its percentile in the universe, the calibrated outperformance probability beside it, the top factor drivers and their share, and the observations the note draws from them.
- Investment drivers and outlook. The latest reported results and, where analysts publish them, the consensus estimates, and the drivers, written from a facts pack that records the source of each input.
- Key considerations. The upside and the downside reading of earnings growth, valuation, margins and balance sheet, side by side.
- Price action and technicals. Price against the 20-, 50- and 200-day moving averages, RSI and MACD, with the technicals table.
- Appendix. Definitions, data scope and lineage, research governance, and the model disclosure.
Cover
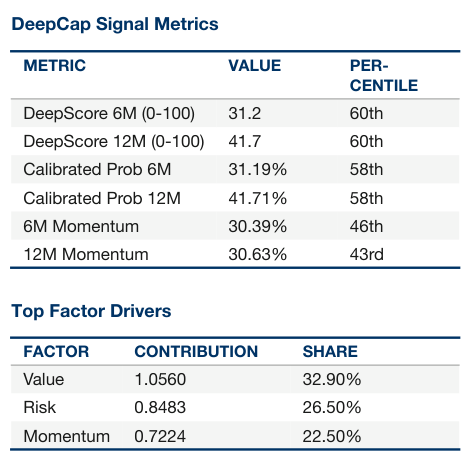
3 DeepCap investment summary
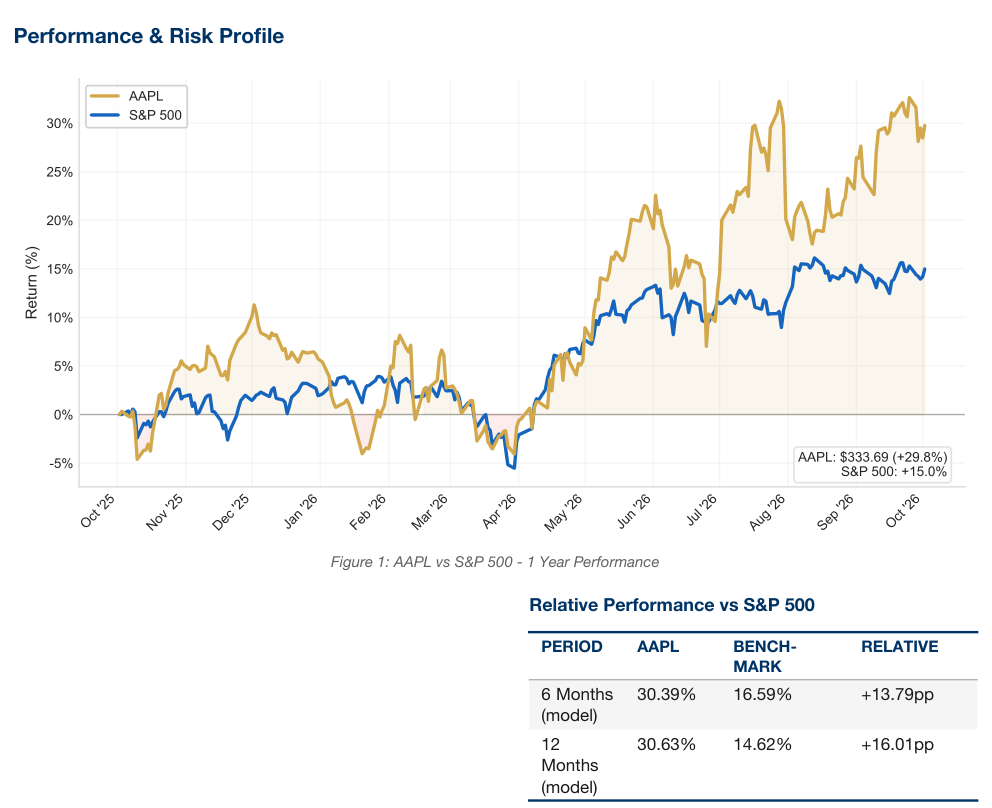
2 Performance and risk profile
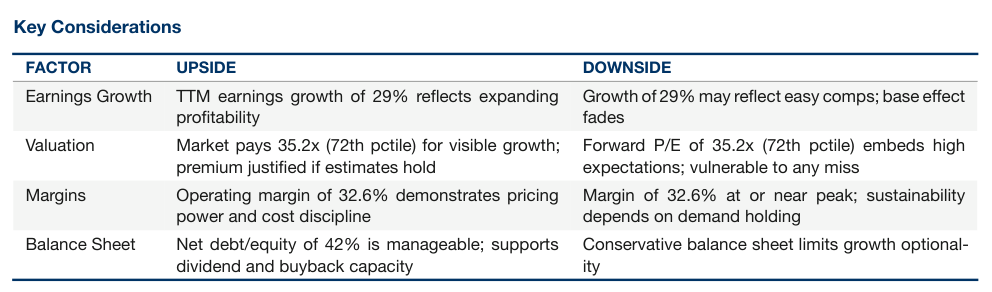
5 Key considerations
Four excerpts from the Apple note of the run of 2 October 2026: the cover; a one-year chart of Apple against the S&P 500 with its six- and twelve-month relative returns; the signal metrics and top factor drivers tables from the investment summary; and the key considerations table.
Anatomy of an Insight note
The cover and three sections of the note, numbered as in the list above.
Excerpt from the Insight note on Apple Inc. for the run of 2 October 2026, rendered on 9 October 2026 for this page. Not current research.
The DeepScore is a 0 to 100 score built from the calibrated probability that a company beats its regional benchmark with a positive return over six or twelve months, adjusted by the flags described on the Methodology page. A company that fails the investability filters cannot enter a DeepList, and its published score is held at or below the lower quartile of the raw scores in that run and region.
A scale from 0 to 100. Companies that pass the investability filters can score anywhere on it. Companies that fail them are held at or below the lower quartile of the raw scores in the run.
The DeepScore scale
Companies that pass the investability filters can sit anywhere from 0 to 100; companies that fail them are capped at the lower quartile of the raw scores.
Source: DeepCap scoring rules, as of the run of 25 September 2026.
The lower quartile is measured in each run and region, so the cap moves; its position here is schematic.
How a note is produced
The figures in a note are drawn from DeepCap's pipeline and its data vendors, gathered into a facts pack of resolved metrics. The language model writes the narrative from that facts pack and is instructed not to invent a figure. Each facts pack passes quality checks before a note is rendered, and the note states its data sources, its report version and the time it was generated.
-
1
Data
Prices, fundamentals and model estimates from the pipeline and the data vendors
-
2
Facts pack
Resolved metrics, checked for missing fields, stale data and implausible values
-
3
Narrative
Written by the language model from the facts pack, under an instruction not to invent figures
-
4
Render and deliver
The PDF, with its data sources and report version, delivered to the portal with each run
Coverage and cadence
Insight draws on the listings DeepCap screens: 2,642 in the United States, 2,081 in Europe and 5,230 in Asia in the run of 25 September 2026, of which 2,507, 128 and 5,087 received a score. Notes are produced for the companies on the current DeepLists with each run and delivered to your portal as PDFs, bundled by region.
| Region | Listings screened |
|---|---|
| United States | 2,642 |
| Europe | 2,081 |
| Asia | 5,230 |
DeepList overviews
Alongside the company notes, each run produces a DeepList overview for each region: the lists at a glance, factor tilts, entries and exits with their scores, sector composition and upcoming earnings.
Limits
The DeepScore ranks companies by an estimated probability, and the estimate is wrong a substantial share of the time. The model is retrained with each run, and each note names the run it comes from. Coverage differs by market. European companies have been scored on financial statements matched by ticker code, which for most of them belong to a different, US-listed company, and a European note can print those figures. European lists have also included companies outside the screened universe. The correction is in development. Insight does not make recommendations and does not set price targets.