Let's Shape The Future Of Your Investments!
Beat the market with DeepCap's stock picks and investment strategies.
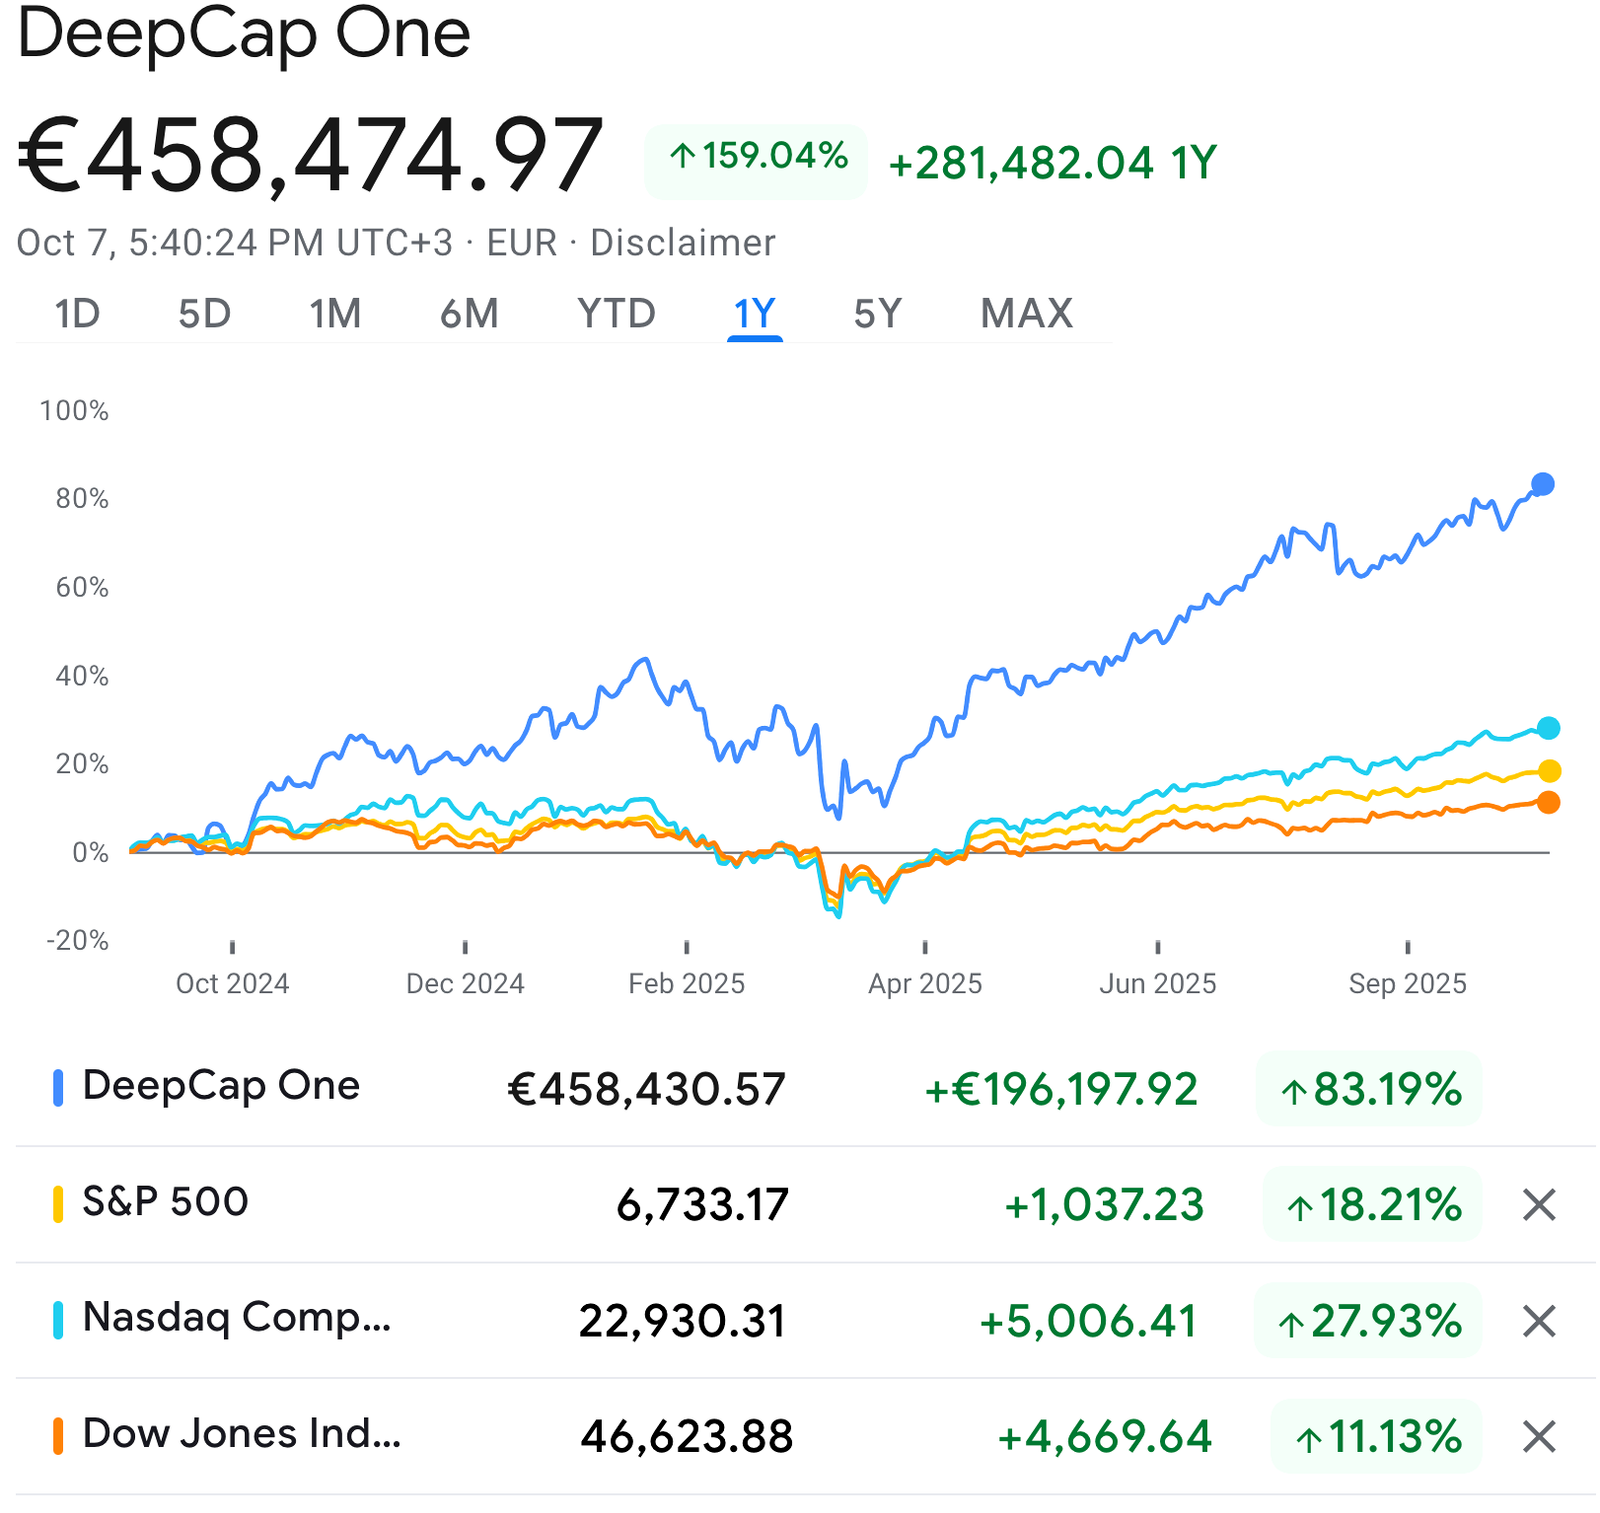
DeepCap consistently outperforms market indices: Insights and Updates
A snapshot of DeepCap One, our equal-weight portfolio built from DeepCap AI’s stock picks (our DeepLists) and vetted by our analysts.
As of Oct 7, 2025 (UTC+3) · Currency: EUR
Figures shown are from DeepCap’s tracking portfolio; fees, taxes, and slippage are not included.
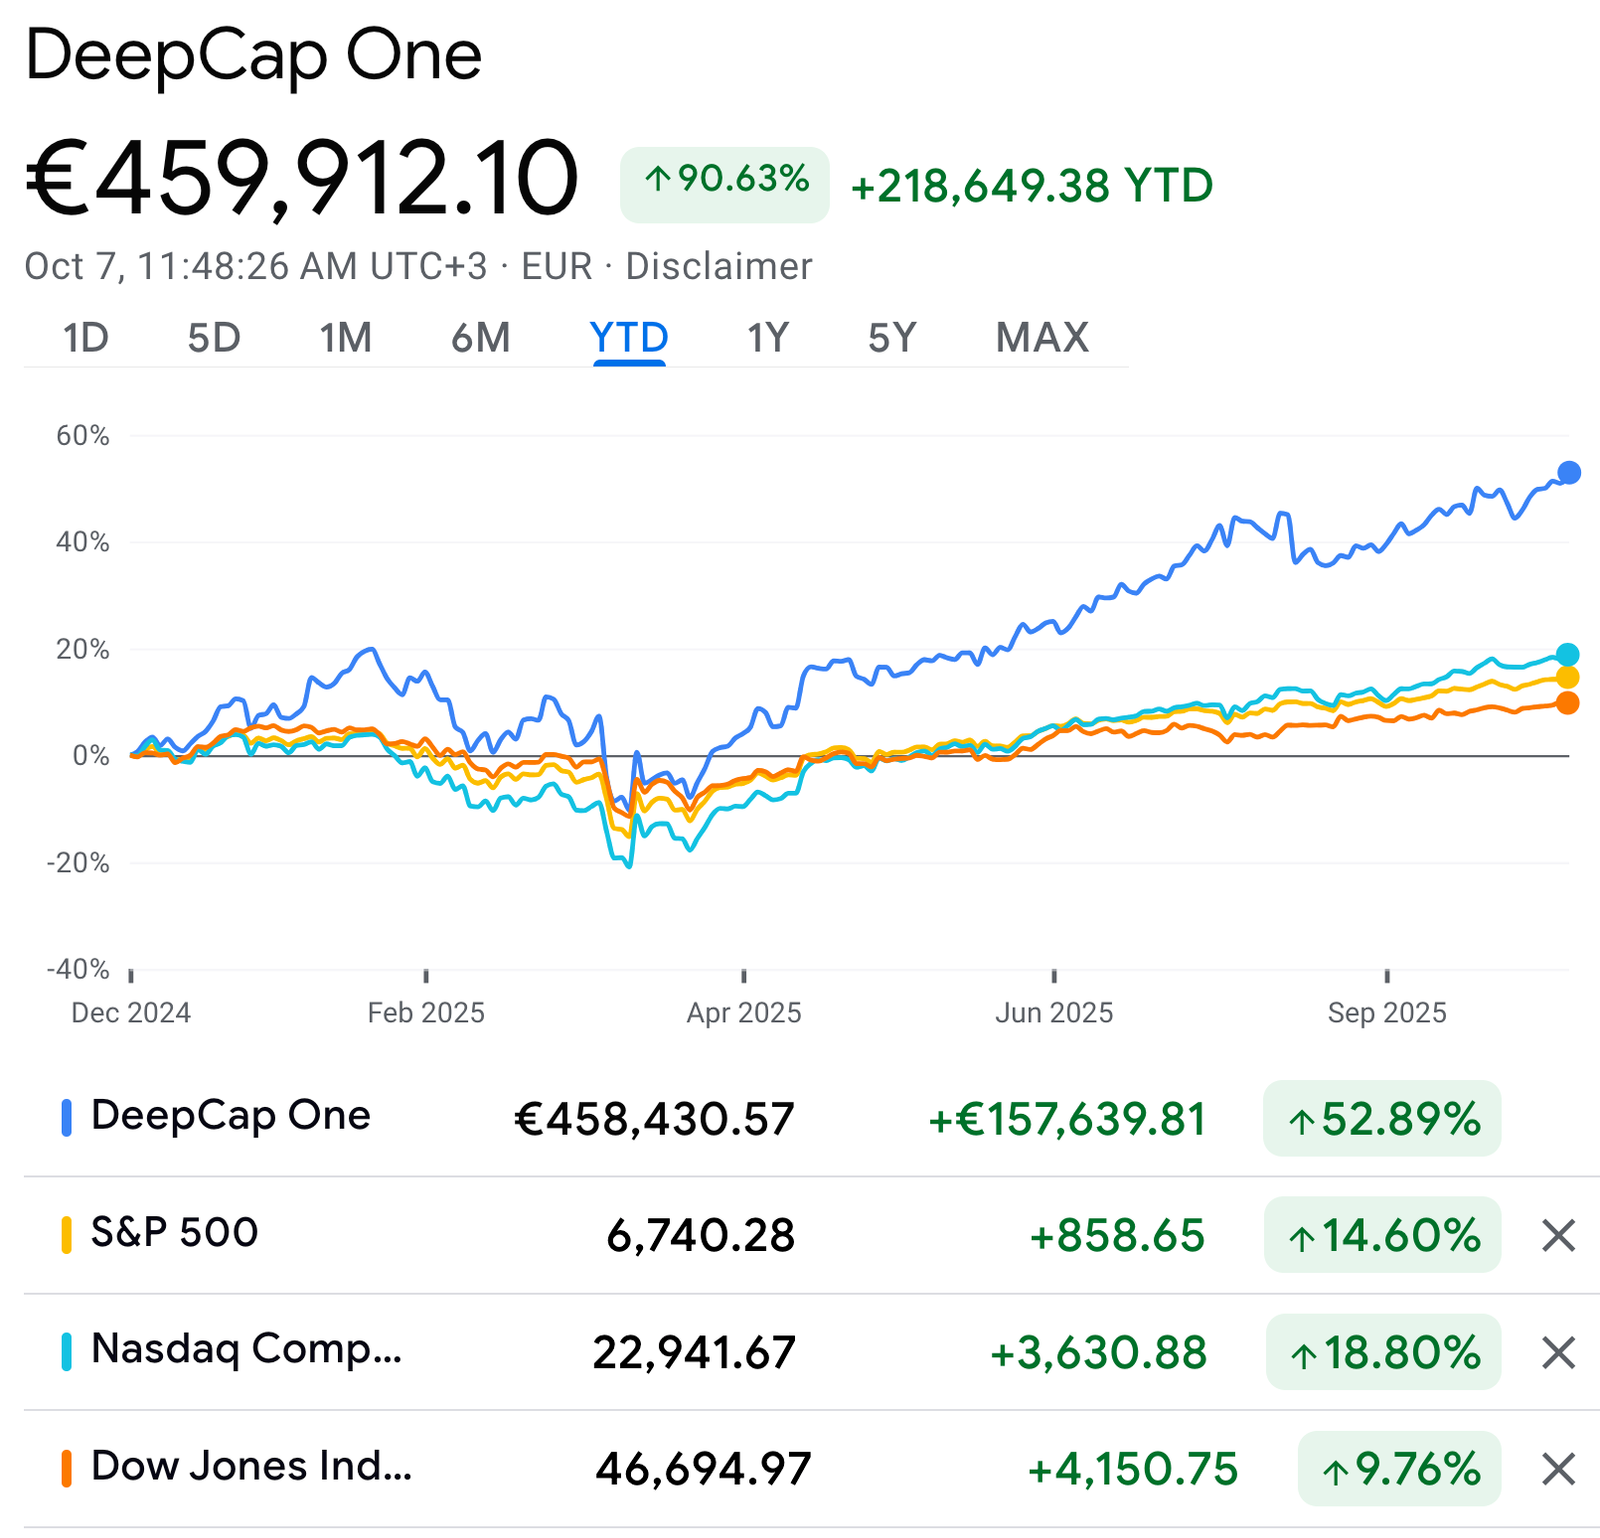
DeepCap One has outpaced the major indices YTD.
| Portfolio / Index | Level | YTD Change (€ / pts) | YTD % |
|---|---|---|---|
| DeepCap One | €458,430.57 | +€157,639.81 | +52.89% |
| S&P 500 | 6,740.28 | +858.65 | +14.60% |
| Nasdaq Composite | 22,941.67 | +3,630.88 | +18.80% |
| Dow Jones Industrial Avg | 46,694.97 | +4,150.75 | +9.76% |
Snapshot values taken from the same capture used for the chart above. For live numbers, please refer to the dashboard.
A systematic, risk-aware process that blends AI with human oversight.
Subscribers see the names, weightings, refresh dates, and receive alerts ahead of significant events or list changes.
Members also receive alerts, analysis, and event triggers.