DeepList Performance
Three lists of top-probability scoring stocks tracked since inception. No backtests, no cherry-picking. Every rebalance and change logged; every holding recorded.
High-Conviction
Stocks that score highly on both the 12-month trend and 6-month momentum models. The overlap filter. Concentrated, highest-confidence picks.
12M Trend
Stocks with the strongest probability of outperforming over a 12-month horizon. Captures structural re-ratings, earnings inflections, and longer-duration moves.
6M Momentum
Stocks with the strongest near-term momentum signals. Faster rotation, shorter holding periods, designed to capture tactical opportunities.
EU DeepLists
DeepCap EU High Conviction
+32.11%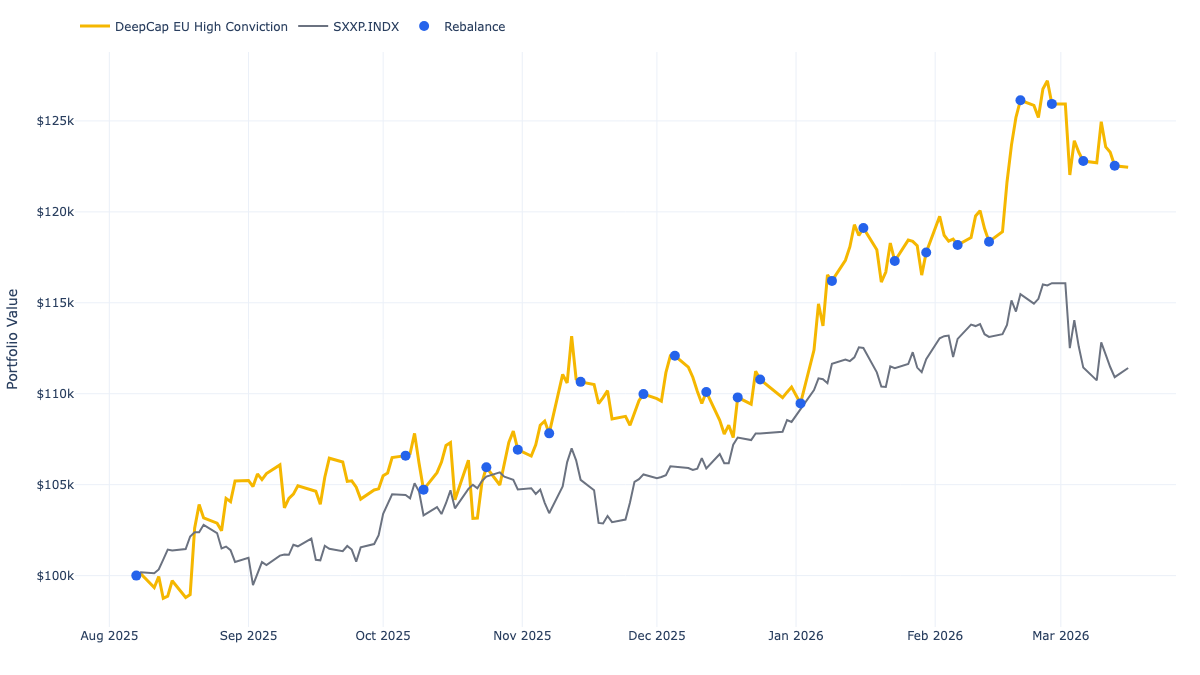
DeepCap EU 12M
+19.19%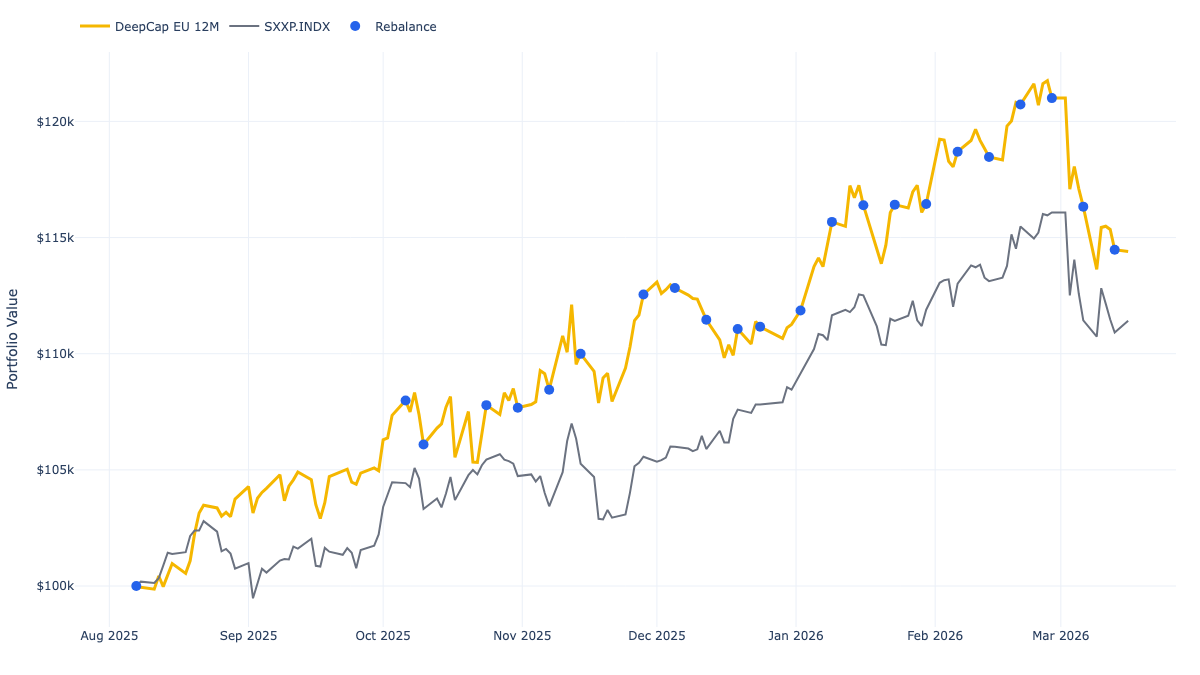
DeepCap EU 6M
+24.38%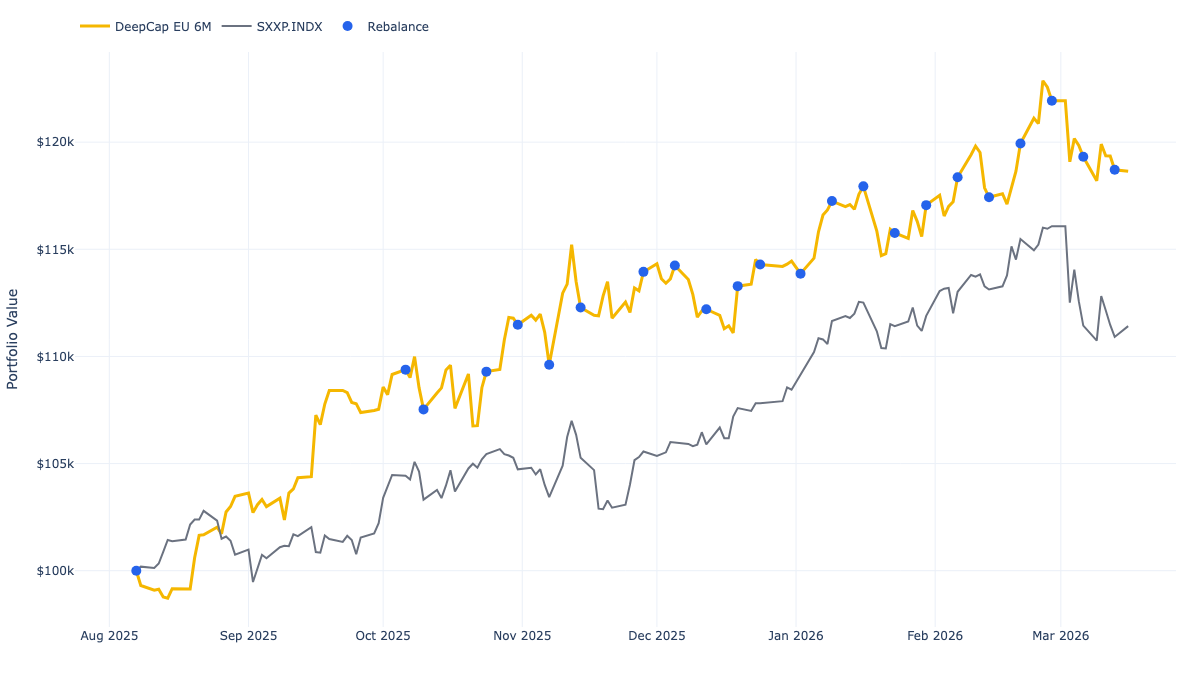
US DeepLists
DeepCap US High Conviction
+72.33%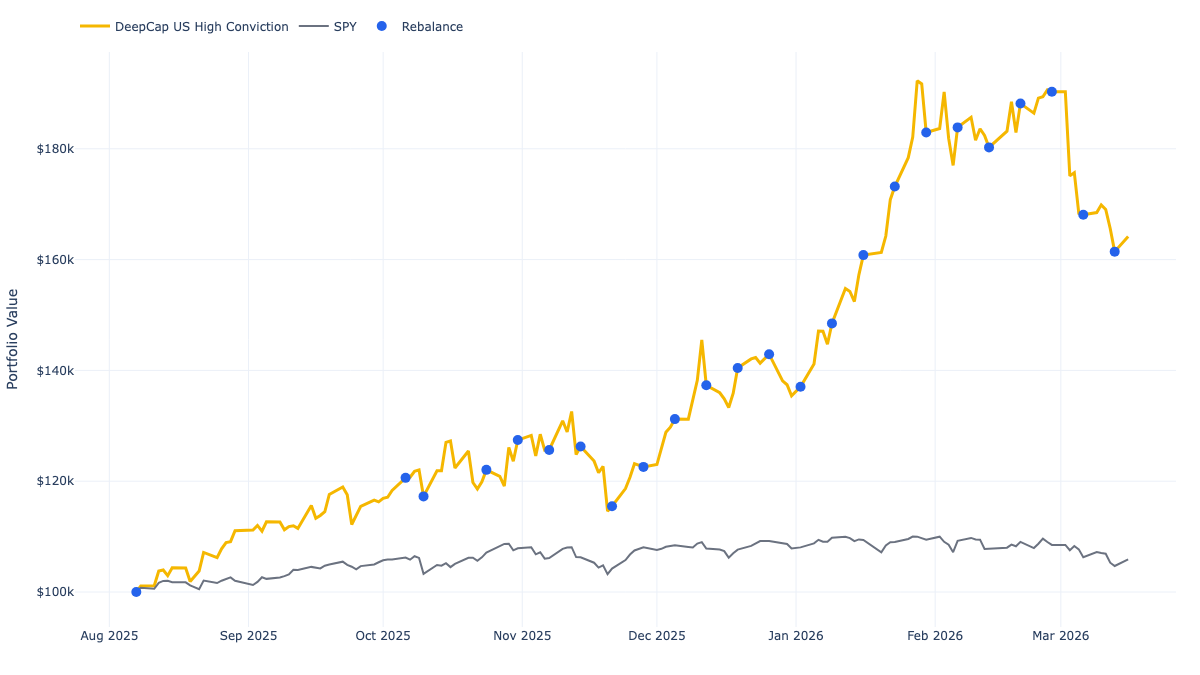
DeepCap US 12M
+68.45%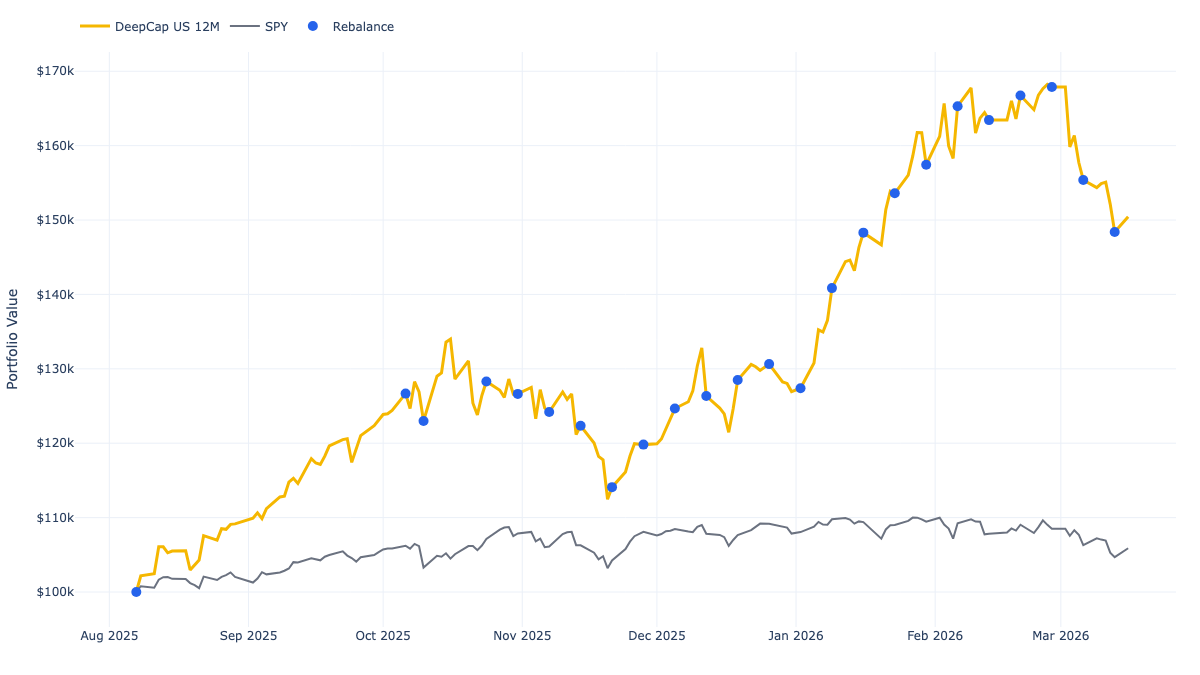
DeepCap US 6M
+52.88%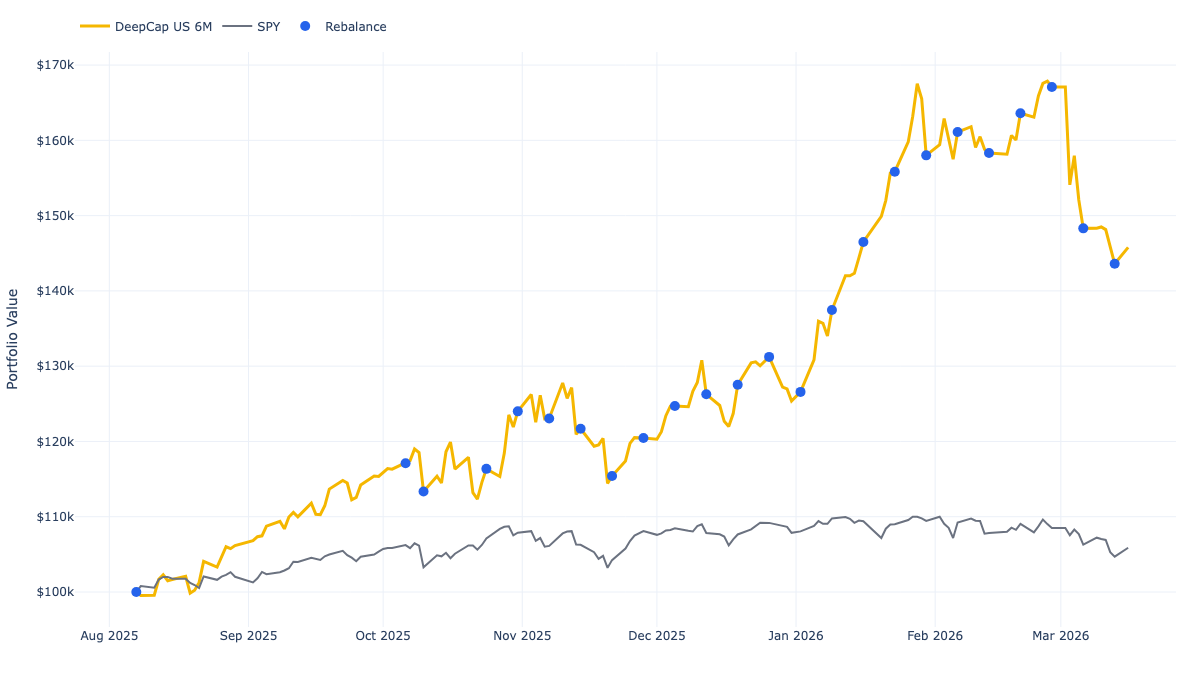
Subscribers see every stock in each DeepList, weightings, rebalance alerts, and event-driven updates.
DeepCap One
An early experimental composite portfolio built from the DeepLists above, equal-weighted and vetted by our analysts. Below is the legacy performance snapshot.
Snapshot
As of Oct 7, 2025 (UTC+3) · Currency: EUR
Figures shown are from DeepCap’s tracking portfolio; fees, taxes, and slippage are not included.
Year-to-Date vs Benchmarks
DeepCap One has outpaced the major indices YTD.
| Portfolio / Index | Level | YTD Change (€ / pts) | YTD % |
|---|---|---|---|
| DeepCap One | €458,430.57 | +€157,639.81 | +52.89% |
| S&P 500 | 6,740.28 | +858.65 | +14.60% |
| Nasdaq Composite | 22,941.67 | +3,630.88 | +18.80% |
| Dow Jones Industrial Avg | 46,694.97 | +4,150.75 | +9.76% |
Snapshot values taken Oct 7, 2025.
How DeepCap One is built
A systematic, risk-aware process that blends AI with human oversight.
- Quality data acquisition — multi-source fundamentals, prices, and events.
- Cleaning & filtering — survivorship-bias control, corporate-action handling, outlier checks.
- Model probabilities — machine learning across two horizons (6M momentum, 12M trend) plus technical confirmation.
- DeepLists curation — 6M, 12M, and a High-Conviction overlap list.
- Analyst vetting — experienced financial analysts review edge cases and catalysts.
- Equal-weight portfolio — 10–20 names; scheduled refresh; benchmark-aware reporting.
Subscribers see the names, weightings, refresh dates, and receive alerts ahead of significant events or list changes.
Members also receive alerts, analysis, and event triggers.
Important Disclosures
DeepCap’s AI analyzes financial data to generate probabilistic scores indicating the likelihood a stock may outperform the market — not predictions or guarantees of future performance. Model portfolio results shown are based on tracked, forward-looking portfolios with logged rebalances. They do not include transaction fees, taxes, or slippage. Past performance is not indicative of future results.
DeepCap’s scores and analysis are for informational purposes only and do not constitute financial advice, investment recommendations, or a substitute for independent research and professional counsel. Invest at your own risk.